Extract from The Guardian
The One Nation senator dismisses the conventional
scientific view of climate change. Here are the holes in his most
commonly deployed arguments
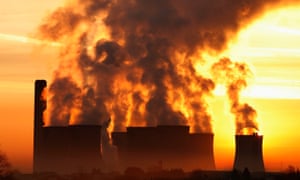
One Nation senator Malcolm Roberts argues that all
the major science organisations around the world have collaborated,
manipulating climate data to suppress temperatures in the 1930s and
40s, thereby making today’s temperatures look unusual. Photograph:
Phil Noble/Reuters
Wednesday 14 September 2016 10.33 AEST
The election of Malcolm Roberts as a One Nation
senator has put Australia’s media in a difficult spot.
In his first
speech to Parliament on Tuesday, Roberts made many false claims
about climate change. He said that climate change was a “scam”
and implied that it was some sort of conspiracy between all the major
international research agencies. “ ... there is no data proving
human use of hydro-carbon fuels affects climate,” he said.
Most news outlets had stopped covering the views
of climate science deniers in regular reporting. There is a clear
scientific consensus that the world is warming and that human carbon
emissions have caused it, so reporting the views of a few non-experts
who push fanciful theories with no credible evidence is seen as
“false balance”.
But journalists are in a different position when
someone in an important office holds such views.
Discussing whether the Guardian would publish
letters from climate change deniers, the readers’
editor wrote in 2013: “Sometimes the identity of a person
expressing an opinion is as interesting as the thing being expressed.
If a member of the royal family wrote a letter denying that climate
change exists the Guardian would almost certainly run it.”
Some have argued the media should ignore the views
of Roberts. But as a senator his views may affect legislation and the
terms of the debate that influence it. So those views are newsworthy,
particularly in the early part of his term when many Australians will
be becoming aware of him for the first time. Guardian Australia will
report them when that is warranted on grounds of public policy
debate.
But to avoid repeatedly having to debunk Roberts’
views, we have produced a handy reference list of his main arguments,
as
outlined on the ABC’s Q&A program on 15 August. This list
may be updated if he introduces new elements to back his claims.

One Nation’s Pauline Hanson with fellow senator
Malcolm Roberts, who is a climate science denier. Photograph: Dan
Peled/AAP
The ‘pause’
Another inconvenient fact, temperatures statistically have not been warming since 1995
One main strategy used by climate change deniers
is to argue that there is no trend in warming, or that the recent
trend is not at all unusual.
They often point to what has been called by some a
“pause” in global warming – also sometimes called the “hiatus”
or “slowdown”. They point to temperatures in 1998 (or sometimes
a bit earlier) and say they were similar to today’s
temperatures. They conclude that therefore global warming has
stopped.
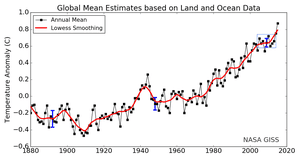
If you look just at the temperatures in the graph
below, ignoring the red trend line which is averaged over longer time
periods, there doesn’t seem to be much warming.
Global surface air and sea surface temperatures
between 1998 and 2013. Photograph: Nasa
The most obvious thing wrong with this argument is
that no climate scientist thinks global warming means temperatures
will always increase at the same rate. The climate has many natural
sources of “variability”, which push temperatures up and down
over months, years and decades. Superimposed over global warming,
that variability can speed up or slow down the warming trend we see.
Short periods of slower cooling are expected as a
result of weather events such as La Niña.
This probably happened between 1998 and about 2013
(although some scientists have controversially suggested
it may not have happened at all). 1998 was a record hot year, and
if you look only at the 15 years that followed, temperatures didn’t
increase much.
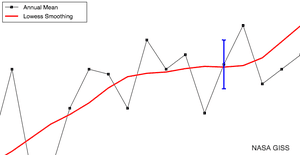
Of course, choosing a record hot year as your
starting point is cheating – just as choosing a record cold year
would be. When you zoom out and look at the longer-term picture,
there is a clear trend. And since 2013, temperatures have
skyrocketed, with 2014 and 2015 (and almost certainly 2016) each
setting new records.
Global surface air and sea surface temperatures
since 1880. The blue box indicates the small region used to suggest
global warming had stopped. Photograph: NASA
Understanding the precise causes of that short
period of slower warming was of interest to scientists but it was not
a challenge to the general picture that the globe was warming – and
continued to warm – on larger timescales.
For what it’s worth, a lot of work suggested the
“hiatus” was a result of an extended La Niña-like period in what
is called the Pacific decadal oscillation, in which heat from the
atmosphere was being stored just under the surface in the Pacific
Ocean. That process now looks as though it has reversed, releasing
the heat and causing a sharp temperature rise.
‘Manipulation’ of the data
MALCOLM ROBERTS: Yeah, 1930s and 40s were warmer than the current decades … The original records are … first of all, that the data has been corrupted and we know that the 1930s were warmer than today.
BRIAN COX, fellow Q&A panellist and physicist: What do you mean by corrupted? Corrupted? What do you mean corrupted?
ROBERTS: Been manipulated.
COX: By who?
ROBERTS: By Nasa.
COX: Nasa?
ROBERTS: Yes.
This is an example of two strategies in one. The
first is to deny there is a warming trend, or that it is unusual, as
in the “hiatus” claim.
When scientists point out that the data
contradicts the claim, climate change deniers sometimes resort to
conspiracy theories. In this case, Roberts argues that all the major
science organisations around the world have collaborated,
manipulating climate data to suppress temperatures in the 30s and
40s, thereby making today’s temperatures look unusual.
The weird thing here is that Roberts isn’t even
getting the conspiracy theory right. The theory he is thinking of –
which even most climate change deniers now reject – is not that
global temperatures were higher in the 30s and 40s, but that
specifically temperatures just in the US were higher than today.
Climate scientists used to believe that was the
case. Even then, they knew the world as a whole was warming, so the
scientific discussion revolved around trying to explain the spatial
variation – why temperatures in the US were different. It was in no
way a challenge to the clear observation that global temperatures
were rising sharply.
The chart below is from a paper
published in 1999 discussing this issue and comparing the known
global temperature rises with the understanding of US temperatures at
the time.
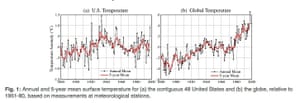
Graphs from a 1999 Nasa paper comparing how
scientists then interpreted US temperatures with global temperatures.
The problem was, records going that far back are
based on all sorts of measurements that are difficult to compare –
some are taken at different times of day or at different altitudes.
And many locations or times change over the period.
Figuring out how to put them all on the same scale
involves complex calculations. More than 15 years ago, Nasa’s
method of doing so resulted in the conclusion that US temperatures
were unusually high in the 30s and 40s.
Then Nasa expanded the data set it used to include
information about ocean temperatures and corrected for the then
well-documented “urban
heat island” effect.
The changes didn’t alter the trend much but did
mean that the hottest year on record in the US became 1998 rather
than 1934. As data and understanding improved, further adjustments
were made by Nasa in 2011, which revealed more of a warming trend
across the US.
All the changes were
discussed by Nasa at the
time but more than a decade later climate deniers picked this up
and claimed it was a conspiracy.
There is no such thing as meaningful raw data when
it comes to historical temperature records – they must be
interpreted. With more data and better understanding, that
interpretation will change. And since several different organisations
around the world do their own interpretations of the data and agree
on the outcome, confidence in their results can be high.
In any case, Roberts’ claim that global
temperatures were higher in the 30s and 40s is not even a conspiracy
theory that is held by anyone. And the claim that Nasa secretly
manipulated data to hide the fact that those decades were warmer than
today in the US is plainly false.
Even if temperatures in the US were higher then
than they were recently – as scientists thought in 1999 – it
wouldn’t change the global picture, which for a long time has
clearly shown increasing temperatures.
Trashing the models
The models have already been proven wrong, hopelessly wrong.
The truth is that climate models have been shown
to work remarkably well.
Models predict trends in climate, not particular
events. So a few years – even up to a decade or so – that isn’t
quite what a model predicted is not evidence the model is flawed.
But the performance of climate models over the
past few decades has been amazingly accurate.
The image below comes from the latest report of
the UN’s intergovernmental panel on climate change. It shows how
observations
of temperatures have compared with climate models since 1990.
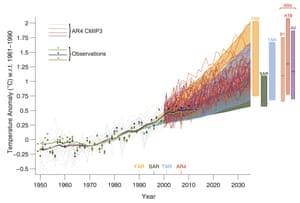
There are a lot of graphs floating around the
climate denier corners of the internet that cherry-pick some of the
observations and compare them with just some of the model
simulations, and usually don’t include the shading to show the
uncertainty in those projections.
Between 1998 and 2013, the observed temperatures
were towards the lower end of the models’ predictions. That is not
surprising, and it doesn’t mean the models aren’t working – the
temperature rise has still been within the expected range.
But a
paper last year showed the difference between prediction and
observation has been exaggerated, since while models are all about
surface air temperatures, the observations they were compared with
have traditionally been a combination of air temperatures over land
and sea surface temperatures, which are warming more slowly than the
air above the seas.
Correcting for that created a model that let
scientists to compare apples with apples, which showed the difference
between the simulation and observations shrank considerably. That can
be seen in the image below, where in the lower panel the shaded area
drops a bit lower, putting the observed temperatures closer to the
centre of the modelled temperatures.
The difference that was left was likely to be
simply a result of natural variability, which caused warming to slow
slightly and temporarily.
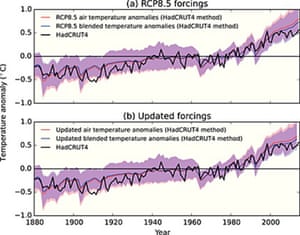
Before (top) and after (bottom) adjusting the
models so they projected temperatures in a way that could be compared
like-for-like with observations. Photograph: Schmidt et al. (2014)
Historical distractions
The latest warming cycle in the 17th century going into the 18th century was faster and greater than the latest warming …
It’s not clear what Roberts is talking about
here.
In the northern hemisphere there was a period of
relatively cold weather between about 1550 and 1800, known as the
“little ice age”.
No recent or even outdated studies suggest it was
warmer around 1700 than it is today. One book from 1965 – one of
the first works to suggest there was a “little ice age” – did
suggest some rapid warming towards 1700 in the northern hemisphere as
the world emerged from the cold period. But that was based on very
limited data and, even in that work, temperatures were not thought to
have risen to unusual heights. And newer work based on much more
detailed records suggests any cool period at roughly that time was
much less pronounced than previously thought.
This statement highlights another strategy used by
climate deniers. Making a spurious claim about temperature records
attempts to put the onus of proof on the interlocutor. It is so
unclear what Roberts is talking about that it is hard to make a case
against him.
‘It’s basic’
It is basic. The sun warms the earth’s surface. The surface, by contact, warms the moving, circulating atmosphere. That means the atmosphere cools the surface. How then can the atmosphere warm it? It cannot. That is why their computer models are wrong.
It’s honestly just not clear where to start with
this quote. Is he doubting that the sun can warm the atmosphere? If
so, then why is the atmosphere not freezing? Is he arguing that
because the earth’s surface is warmer than the air above it (which
is true over land), that the atmosphere can’t warm?
How should the media cover Roberts’ claims?
Media outlets are drawn in two competing
directions when deciding how to cover Robert’s false claims.
On the one hand, it has become common practice not
to report climate change denier views as a matter of course. And so
editors might be drawn to ignore his claims. But as discussed above,
his views could now have relevance and importance – not because
they are potentially true, but because they could influence the
workings of parliament.
On the other hand there can be the opposite drive
too. His views can be such good fodder for headlines, that there is a
temptation to cover everything he says. But taking that path allows
politicians to manipulate the media, driving them to say even more
outrageous things to garner even more headlines.
Roberts’ views should simply be reported when
they are newsworthy, no more and no less. Of course this can be a
tricky thing to judge, but newsrooms should be experienced at making
such decisions.
No comments:
Post a Comment