Electorates that swung to the government more likely to have higher unemployment, lower income and fewer migrants
Electorates that swung harder to the Liberal and National parties are
more likely to have higher unemployment, lower income, lower levels of
education and fewer migrants, according to a Guardian Australia
analysis.
Conversely, electorates that swung to Labor are more likely to have higher levels of education, more young people, more people in work or study, and more people over the age of 80.
And, perhaps surprisingly, electorates with larger numbers of people receiving franking credit refunds or making use of negative gearing on properties were less likely to swing to the Coalition.
While we don’t yet know why more people voted for the Coalition over
Labor, looking at the characteristics of electorates that swung towards
the government can give us some ideas as to what sections of the
population were more inclined to vote for them (or vote for minor parties in the first instance, and then preference the major parties highly).Conversely, electorates that swung to Labor are more likely to have higher levels of education, more young people, more people in work or study, and more people over the age of 80.
And, perhaps surprisingly, electorates with larger numbers of people receiving franking credit refunds or making use of negative gearing on properties were less likely to swing to the Coalition.
Using data from the 2016 census and figures on negative gearing and franking credits from the Australian Taxation Office, I looked at the correlation between a range of demographic and socioeconomic figures with two-party-preferred swing. That is, as swing to the Coalition increases or decreases, how does something like median income increase or decrease?
It’s important to emphasise what this type of analysis doesn’t tell us. Despite the correlations, this analysis doesn’t show that recent migrants voted for Labor, or people on lower incomes voted for the Coalition. It just shows which aspects of an electorate were associated with a swing either way. We won’t know what actually influenced voter decisions until election-related surveys like the Australian Electoral Study are published.
Included with each chart, and in the text, is a measurement of how strong the association between the swing and the variable is. This measure is known as the “r value”, and varies between -1 and 1. A value closer to -1 or 1 indicates stronger correlation, while a lower value like 0.2, indicates a weaker correlation.
Excluded from this analysis are seats that didn’t have a contest primarily between Labor and Coalition candidates, as it skews the two-party-preferred measure given by the Australian Electoral Commission.
Income and tax
As median weekly income decreases, the swing to the Coalition increases:It’s also worth noting that several of the richest electorates, including Wentworth and Warringah, were excluded from this as they had contests between independents and Liberals.
The ATO publishes statistics that include the number of people receiving franking credits by postcode, and the number of people with a “net rent loss”, which indicates those negatively gearing property investments.
I used these figures to get a rate for the number of people receiving franking credits for every 100 people in the electorate, and for the number of people negatively gearing a property for every 100 people in the electorate (see the notes section below for more information about this).
This is of obvious interest as the Coalition and industry lobby groups ran a substantial scare campaign against Labor’s policies to remove franking credit refunds for people who paid no tax and to abolish negative gearing on existing properties from January 2020.
It is worth noting that the ATO’s figure of people receiving franking credit refunds is not exactly the same group of people that Labor’s policy would target, as Labor’s policy only proposed to end the cash refunds for people who hadn’t paid tax, and the ATO data includes all people receiving franking credits.
There was a weak, negative correlation with both the franking credit and negative gearing figures with swing to the Coalition. That is, as the rate of people receiving franking credits goes up, and the rate of people negatively gearing properties goes up, so does the swing towards Labor. This is the opposite of what you’d expect if the Coalition’s campaign had influenced these groups to vote against Labor.
Work and education
One of the strongest correlations between swing and the data I considered was with education and employment status.The percentage of people who had completed year 12 in an electorate was moderately correlated with a swing towards Labor. That is, electorates with higher education rates were more likely to swing towards Labor, and electorates with lower rates of education were more likely to swing towards the Coalition.
Electorates with a higher proportion of the population in full-time work or study were more likely to swing to Labor:
Age and immigration
The only two age groups that showed a correlation with swing were the percentage of 18 to 34 year olds in an electorate, and the percentage of people aged over 80 in an electorate.The number of recent migrants in an electorate was also a good indicator for a swing to Labor. Both the proportion of people who were recent migrants, and the proportion of people who were born overseas were positively correlated with a swing to Labor.
Geographic trends
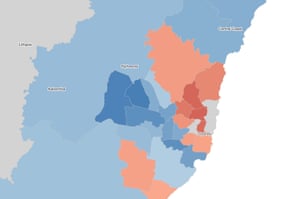
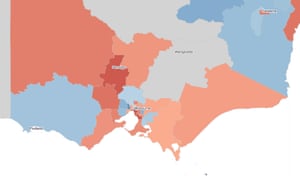
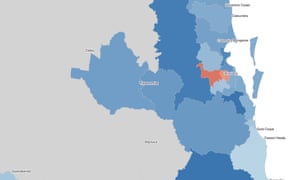
It has been reported widely that Queensland swung hard for the Coalition, and Victoria swung for Labor, which is immediately obvious when looking at the swing by state.Within this overall trend, there are some interesting geographic divides.

In Victoria, it’s a different story, with a number of regional electorates swinging to Labor.

In Brisbane, two inner-city electorates and the division of Ryan in the western suburbs were the only ones that swung towards Labor.

Because of this, I had a look at the correlation between the number of coalmines in an electorate, and swing to the Coalition, and seats with more mines do tend to have a higher swing in that direction:
Notes and data
Census data for current electoral divisions is from here. The ATO data on franking credits is reported by postcode in the ATO’s tax statistics publication. I converted the figures to electorates using a postcode-to-electorate correspondence, and then adjusted to a per-population figure using the 2016 census population number.Figures on negative gearing were generated in the same way by the Parliamentary Library. Coalmine numbers are from 2015 (and some mines have since closed).
Correlation results and data are here.
Update
I have added some more information about the strength of correlation, and how it should be interpreted.

No comments:
Post a Comment