Extract from The Guardian
Data shows most high-income business owners vote for the Coalition and most lower-income workers vote for Labor
Battlers.
The working class. Ordinary voters. Since the Australian federal
election, there have been claims these voters abandoned Labor for the
Liberal-National Coalition. Similar to the idea of “Howard’s battlers”,
commentators have asserted that Labor has become the party of wealthy
inner-city elites, while the Coalition has become the party of “quiet Aussies”.
Much of the commentary is starting to develop an argument along the lines that Scott Morrison’s daggy suburban dad charm beat out the parties of the left – which have been portrayed by some as representing inner-city elites – for the support of struggling workers employed in manufacturing and retail.
However, the reality of this election was very different. The Coalition remains disproportionately the party of high-income business owners and the Labor party lower-income workers, the disabled and low-income parents.
Many of these claims are based on confusion between aggregate movements in vote choice
and the behaviour of individuals. They find that electorates with lower
than average incomes, lower levels of education, and more renters,
moved towards the Coalition. Besides linking (often small) swings with
overall levels of support, they are also committing ecological
fallacies.Much of the commentary is starting to develop an argument along the lines that Scott Morrison’s daggy suburban dad charm beat out the parties of the left – which have been portrayed by some as representing inner-city elites – for the support of struggling workers employed in manufacturing and retail.
However, the reality of this election was very different. The Coalition remains disproportionately the party of high-income business owners and the Labor party lower-income workers, the disabled and low-income parents.
All this data tells us is that electorates with these characteristics swung towards the Coalition. You cannot make inferences about individuals from aggregate data.
For instance, imagine a hypothetical electorate that is 60% working class and 40% middle class, and was won by the Coalition. Based on their recent performance, some commentators would claim this signifies that the Coalition was supported by the working class. This is not necessarily so. If it won 75% of the middle-class vote, the Coalition could win this seat with the support of less than 40% of the working class in the electorate.
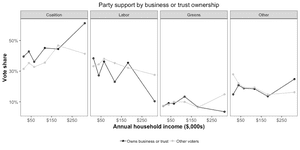
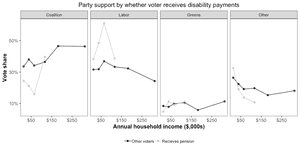
To properly understand how individual voters behave, we cannot rely on aggregate data alone. We need micro data, information on individuals. This is available. We can test whether elites or battlers supported the Coalition or Labor using data collected through the Cooperative Australian Election Survey, which asked 10,000 voters a series of questions over three weeks of the election campaign. Using this data, I look at two measures of elite and battlers status: whether a voter owns their own businesses or a private trust, and whether a voter is on a disability pension. I combine both of these measures with household income to get an idea of how advantaged a voter is. The results indicate that the commentary on the Coalition’s status as the party of the battler may be mistaken.
A meaningful analysis of class has nothing to do with the colour of someone’s collar, their accent or education, but rather their access to resources and relationship with capital. The other things are usually more a symptom rather than cause of class.
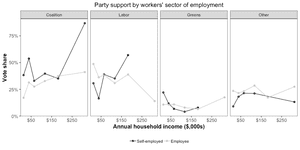
A high-income, self-employed plumber is not working class. They are a capitalist. This is not a pejorative. They own capital (their business) and profit off their own and (potentially) their employees’ labour. They do not necessarily have identical economic interests as a low-income plumber who is an employee, working for someone else and being paid a wage.
While the Coalition received some of its highest support from those earning $208,000 or more who own a business or trust (approximately 60% of whom gave the Liberal-National parties their first preference in 2019), among those who could be better described as working class the picture was very different.
Yes, some blue-collar workers voted for the Coalition, they always do. However, the working class – voters who work in blue-collar jobs, or sales and services, with lower to middle incomes, and who are employees – were not an especially Coalition-friendly group. About 25% of those with average to lower earnings (with household incomes below $78,000 per year) supported the Liberal and National parties with their first-preference votes. Conversely, about half of those with the lowest incomes (below $26,000 a year) voted Labor.
It was only the self-employed in blue collar, and sales and service occupations, with incomes above $208,000 a year who overwhelmingly voted for the Coalition. These voters can hardly be called battlers, working class or even ordinary citizens.

Photograph: Cooperative Australian Election Survey, 2019.
Similarly, around half or more of voters who received both family tax benefits and a parenting payment and had household incomes below $26,000 voted Labor, while almost none voted Coalition (although the sample sizes for this analysis are a little small, so must be treated with caution).

What this means
We need to be careful how we use data to understand election results.While electorates with certain characteristics (lower incomes, lower levels of education, more renters) swung towards the Coalition, we cannot make inferences about individuals from aggregate, electorate-level data. Claims that a particular group swung to or from Labor based on this data are wrong.
Contrary to the narrative forming around this election – that the Coalition has become the party of workers, ordinary Australians or battlers – according to data collected on individual voters during the campaign, its strongest supporters remain high-income business owners. Workers, the disabled and parents on low incomes receiving federal government payments are all more likely to support Labor.
- Shaun Ratcliff is a lecturer in political science at the United States Studies Centre at the University of Sydney
- About this data: The Cooperative Australian Election Survey, 2019 was coordinated by Dr Shaun Ratcliff and Professor Simon Jackman. It comprises a sample stratified by age, gender and state collected through the YouGov online panel. Through this study, 10,316 respondents were surveyed between 18 April and 12 May 2019. This data was weighted by age, gender, education, language spoken at home, and state.


No comments:
Post a Comment